September 2024 Product Updates: Take Control of Your Content Analytics
Topic: Product
Published:
Written by: Bernard Huang
Your content analytics just got smarter with fully Custom Views
In today’s fast-paced marketing landscape, having detailed insights at your fingertips about your content’s organic performance is critical.
At Clearscope, we’ve just made that easier for you.
Introducing a brand-new feature: Editable Columns in your Clearscope Content Inventory.
With this exciting update, you can create tailored views that deliver the exact insights and monitor key KPIs you need to refine your content strategy and grow your organic visibility.
In this quick video, I'll walk you through this new feature. Dig into the details in the article below.
What this new feature offers and why it matters
No two websites are the same, and neither are the insights needed to optimize them.
While Clearscope already offers robust features and tools to help your content rank, we wanted to give you even more control over how you analyze your content performance.
With our new Editable Content Inventory Columns, you can now build your own detailed, customized Content Views that are specific to the metrics and information that matter most to you.
Whether you need visibility into your content by topic, page type, SEO value, lost Page 1 rankings, Google SERP position—or any combination of several key metrics—this new flexibility means better, more actionable insights for your entire Content Inventory.

The Editable Column feature in the Clearscope Content Inventory gives you more metrics for your tracked pages than ever before.
You can customize what data you'd like to see for each page (up to 11 data points) and filter your Content Inventory by 11 different filter types.
Custom column configurations
You can now your view your Content Inventory with data from editable columns (listed below).
Once you've set up your configuration, you then can create a custom Content View for a one-click look at the KPIs that are the most important to you:
Target query: Search query you’re targeting for the page
7-day position: Last 7 days average position from GSC
AMS: Average monthly search volume
Inventory links: Number of inbound (internal) links from pages in your Content Inventory
SEO value: Estimate of how much traffic value was generated by the page over the last 28 days. Calculated by taking top query clicks multiplied by Google Ads CPC data
7-day clicks: Total clicks over the last 7 days from GSC
28-day clicks: Total clicks over the last 28 days from GSC
12-month trend: Graph showing monthly search traffic over the last 12 months
Last modified: Date the page was last modified using “dateModified” schema
Added: Date the page was added to your Content Inventory
All your key metrics in one place
GA4 and Google Search Console offer a wealth of information, but wouldn’t it be great if there was a simplified, streamlined, and easily customizable way to view your content’s performance with the simple click of a button?
Well, there is now.
No more jumping between tools or tabs (or DMing your marketing analyst buddy once again to help you reconfigure your GA4 report).
With editable columns and horizontal scrolling, you can keep all the essential content performance data points visible and fully customizable.
Then, easily save your configuration as a Custom Content View for one-click insights anytime you need them.
As you can see, the Clearscope team takes full advantage of this feature. Create custom Content Views to access key metrics based on topics, funnel positions, target audience, content types, or Page 1 rankings. The possibilities are (almost) endless! Create as many views as you need to streamline viewing key metrics for your Content Inventory.
See it for yourself
Ready to try it out?
Follow the suggestions below to get started with your first few Custom Content Views.
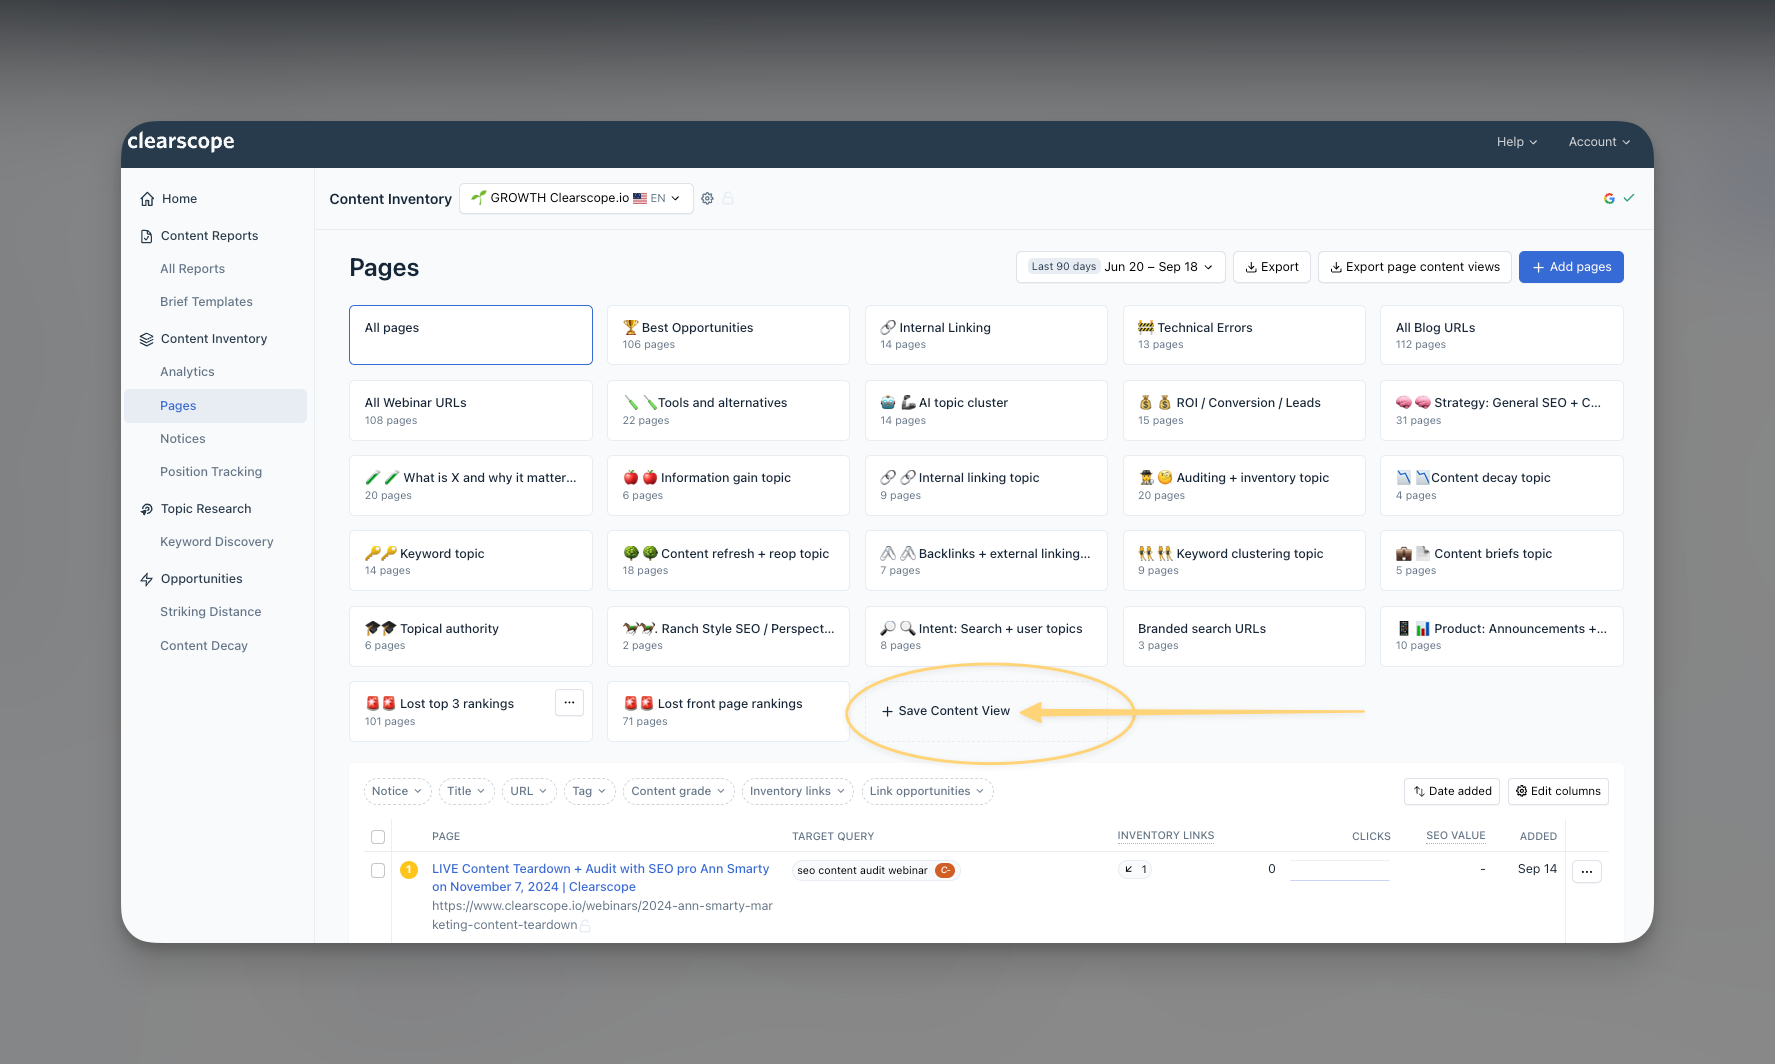
How to create a “Lost front page rankings” view
Navigate to your Content Inventory Pages tab.
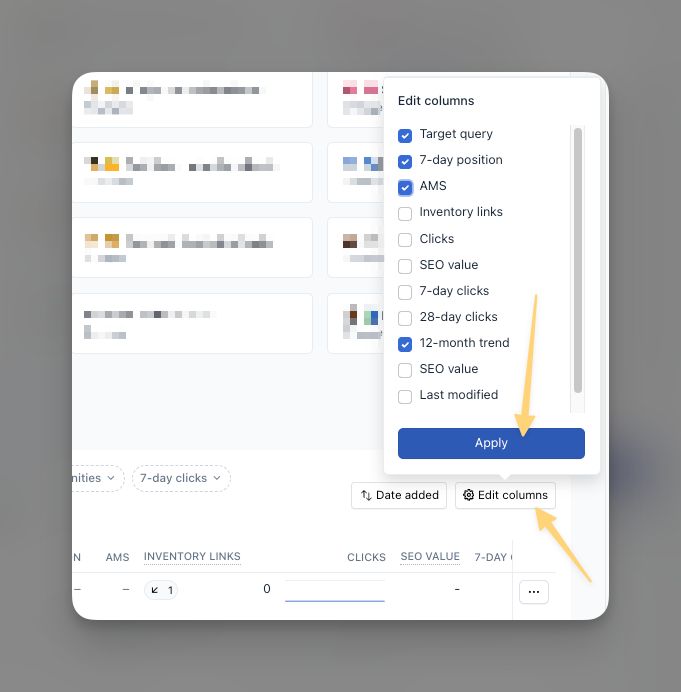
Click the Edit Columns button.
Select all the metrics that you’d like to see for each page, ensuring you have “7-day position” selected.
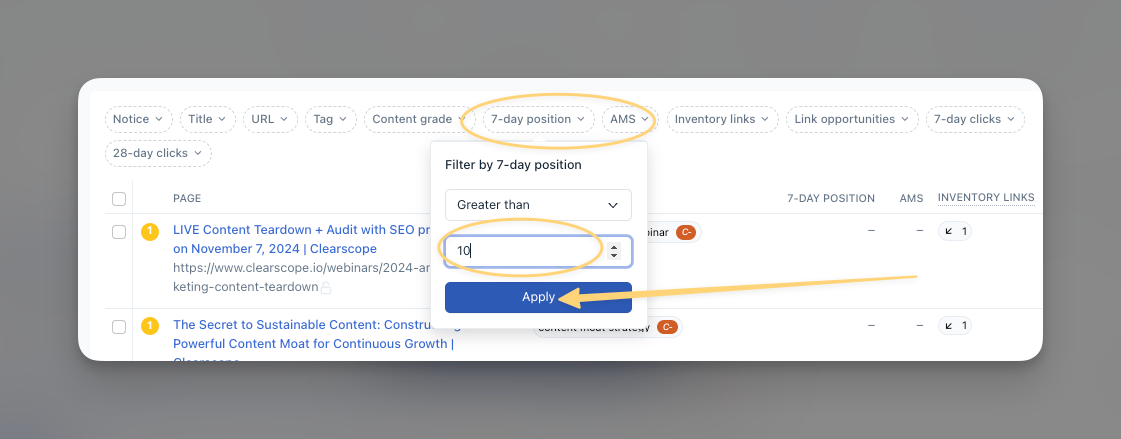
Using the filters at the top of the report, specify a 7-day position greater than 10.
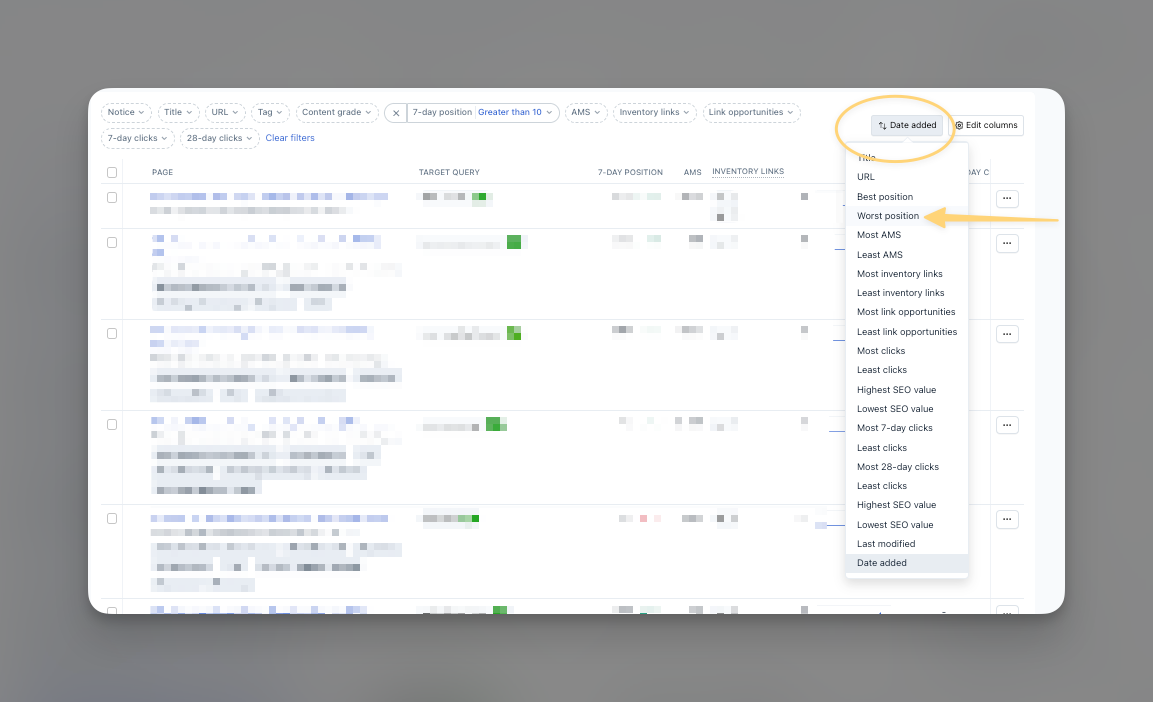
Next, sort your pages by “Worst Position” to see the pages that have been affected the most.
And that’s it! (Yes, it really is that easy.)
You can now save this report as a Custom Content View and access updated data any time with one click.
Click "Save Content View" and name your custom view to have an easy-access, streamlined report that is regularly updated—even after adding new tracked pages to your Content Inventory.
How to create a content topic custom view
Want to easily get a glimpse into how certain content topics are performing?
With Clearscope, it’s super simple.
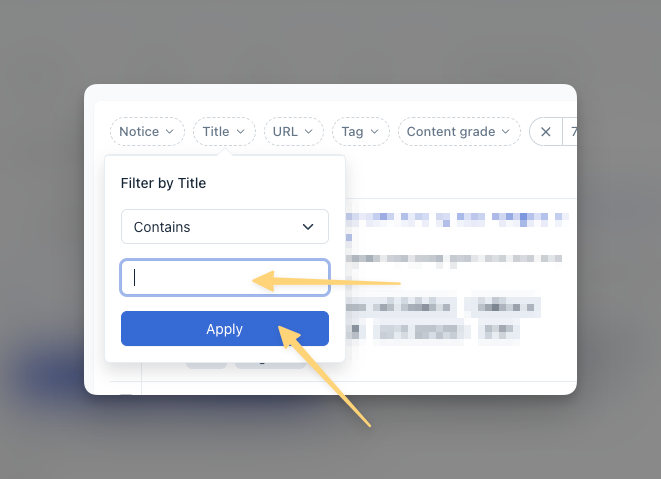
Filter your Content Inventory by “Title Contains.”
For example, within our own inventory of content, we use “gain” to search for all articles on the topic of information gain.
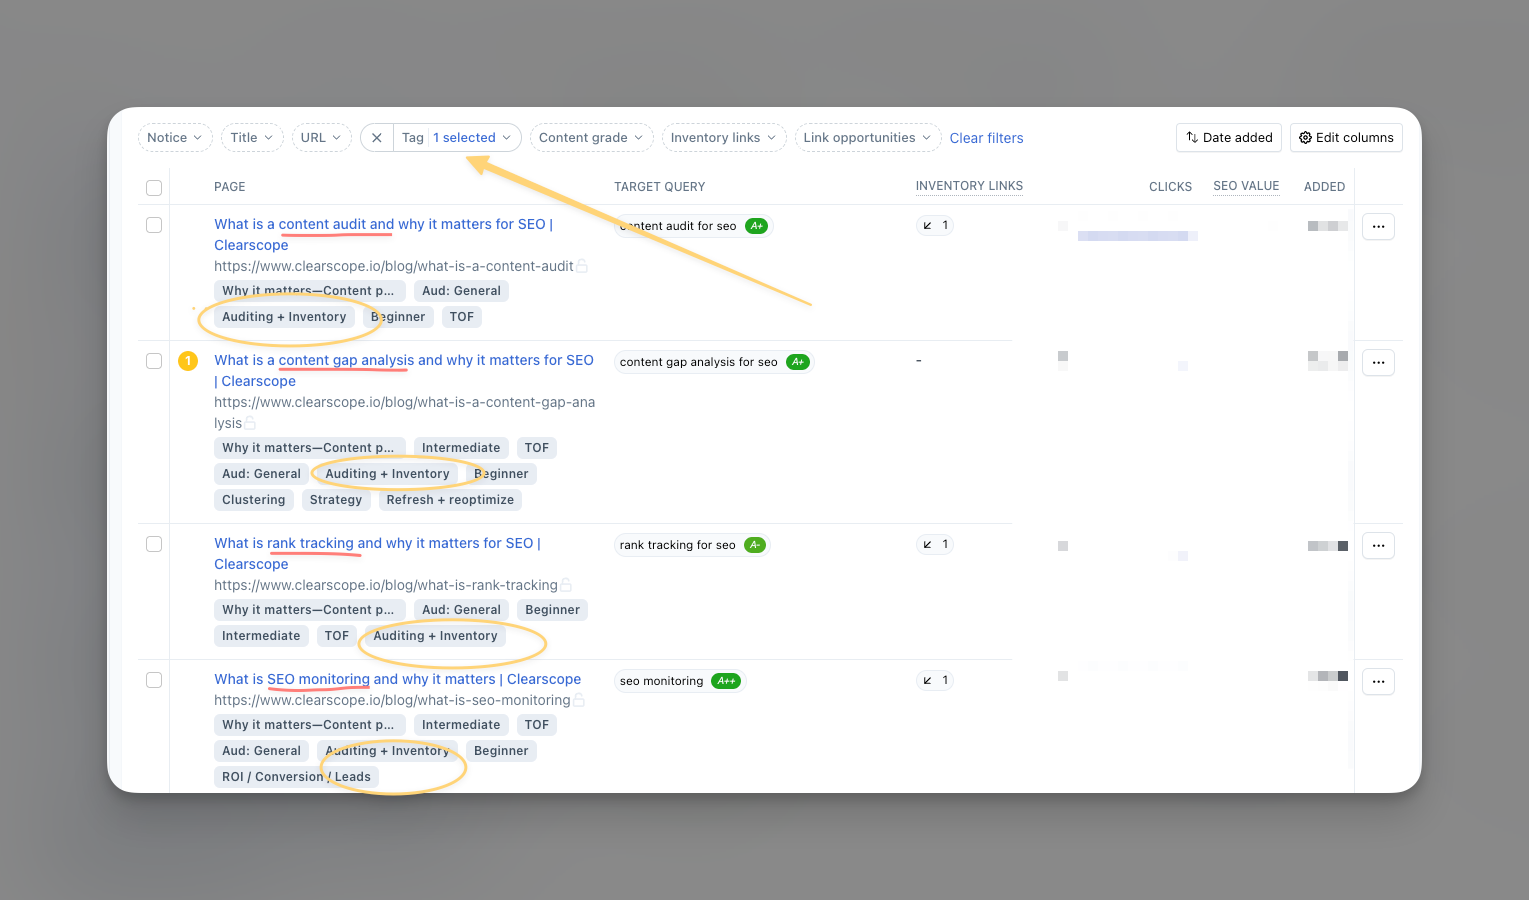
If you have content that lives within all the same topic but goes by different names, create a custom tag for pages in that topic.
For example, Clearscope has a “Content Auditing and Inventory” topic, but we all know content auditing has many different facets that go by different names.
We created the tag “Auditing and Inventory” to sort all these pages into one topic view, including content that targets the keywords [content audit], [content gap analysis], [rank tracking], and [SEO monitoring].
Once you have organized your pages via topics and/or tags, you can customize the metrics you’d like to see for each content topic via the Editable Columns feature.
Save your report as a Custom Content View, and you now have a streamlined view of content performance by topics, one that you can easily export for ease of sharing with key stakeholders.
Ready to explore this game-changing feature for yourself?
Log into the Clearscope platform and start exploring today!
Cheers to smarter content and better results! 🚀
How To Measure and Predict ROI for Your Content Marketing Strategy
Understanding how to calculate content marketing ROI is an essential step in tracking and communicating the effectiveness of your strategy.
Read moreWhat is SEO value and why it matters
Understand what SEO value is, how it’s calculated, its key metrics, and how it can demonstrate the ROI of SEO in your digital marketing efforts.
Read moreTopical Authority: The What and Why
Discover how topical authority improves your SEO results and the best practices you can use to improve your website’s credibility.
Read more